There are a multitude of profilers available for WordPress but they all fail in some way to provide the real results you need.
Query Monitor, for example, is fantastic for profiling database queries, which is normally where performance problems come from, but it lets you down a little when it comes to finding out which plugins or code-paths are using the most time with PHP.
P3 Profiler is next to useless and there’s nothing else – plugin-wise – I’ve found that really attempts to profile the PHP execution paths.
Enter Xdebug – it can profile *anything* that uses PHP and now works with PHP 7.
Table of Contents
Installing XDebug profiler
Run this command:
php -i > ~/phpinfo.txt
Then grab the contents of that phpinfo.txt file and paste them into this web page:
This page will then tell you how to install it, specifically for your server.
For my servers, installation looks like this:
wget http://xdebug.org/files/xdebug-2.4.0.tgz
tar -xvzf xdebug-2.4.0.tgz
cd xdebug-2.4.0
phpize
sudo apt-get install php7.0-dev
./configure
make
cp modules/xdebug.so /usr/lib/php/20151012
Now edit: /etc/php/7.0/fpm/php.ini (and optionally /etc/php/7.0/cli/php.ini), find the modules area and insert the following lines:
zend_extension = /usr/lib/php/20151012/xdebug.so
xdebug.profiler_enable_trigger = 1
xdebug.profiler_output_dir = /var/log/xprofiler/
xdebug.profiler_output_name = cachegrind.out.%t.%p
xdebug.profiler_enable_trigger_value = secretpassword
Note: I set profiler_output_name because the default is cachegrind.out.%p – the %p is the processid, so when the same PHP-FPM process gets used again for serving up another request the previous log file will be overwritten. By adding the timestamp this is avoided. If you do not wish to have a lot of log files, then don’t do this and you’ll only ever have as many log files as you have PHP processes.
Make sure and choose some other characters for the secret password – the xprofiler saves a LOT of information to disk (if you set the profiler_output_name as above), so if a nasty robot finds your site and adds this parameter it could bring your site down very quickly. Save the file and then make sure you create the folder and change the owner so PHP can write to it:
mkdir /var/log/xprofiler
chown www-data:www-data /var/log/xprofiler
Restart the php7.0-fpm service with this command:
service php7.0-fpm restart
Get XDebug profiler to run all the time
If you don’t want to use the URL trigger and instead want to profile everything that happens on your server, you can modify the following setting in php.ini:
xdebug.profiler_enable = 1
And set your profiler_enable_trigger value back to 0.
xdebug.profiler_enable_trigger = 0
Obviously make sure you have enough space because this will dump a lot of data to disk. For more in-depth information check this page out: https://xdebug.org/docs/profiler
Using XDebug profiler to figure out why a WordPress page is slow
Visit one of your problem website pages and append the following parameter to the URL:
?XDEBUG_PROFILE=secretpassword
You will get a whole bunch of profiling data saved to /var/log/xprofiler. You can analyse this data with the visual tool KCacheGrind. Get it for Linux or Windows (for Windows I use QCacheGrind) and download the cachegrind.out.* file(s) to your computer to analyse them and figure out where your poor performance is coming from.
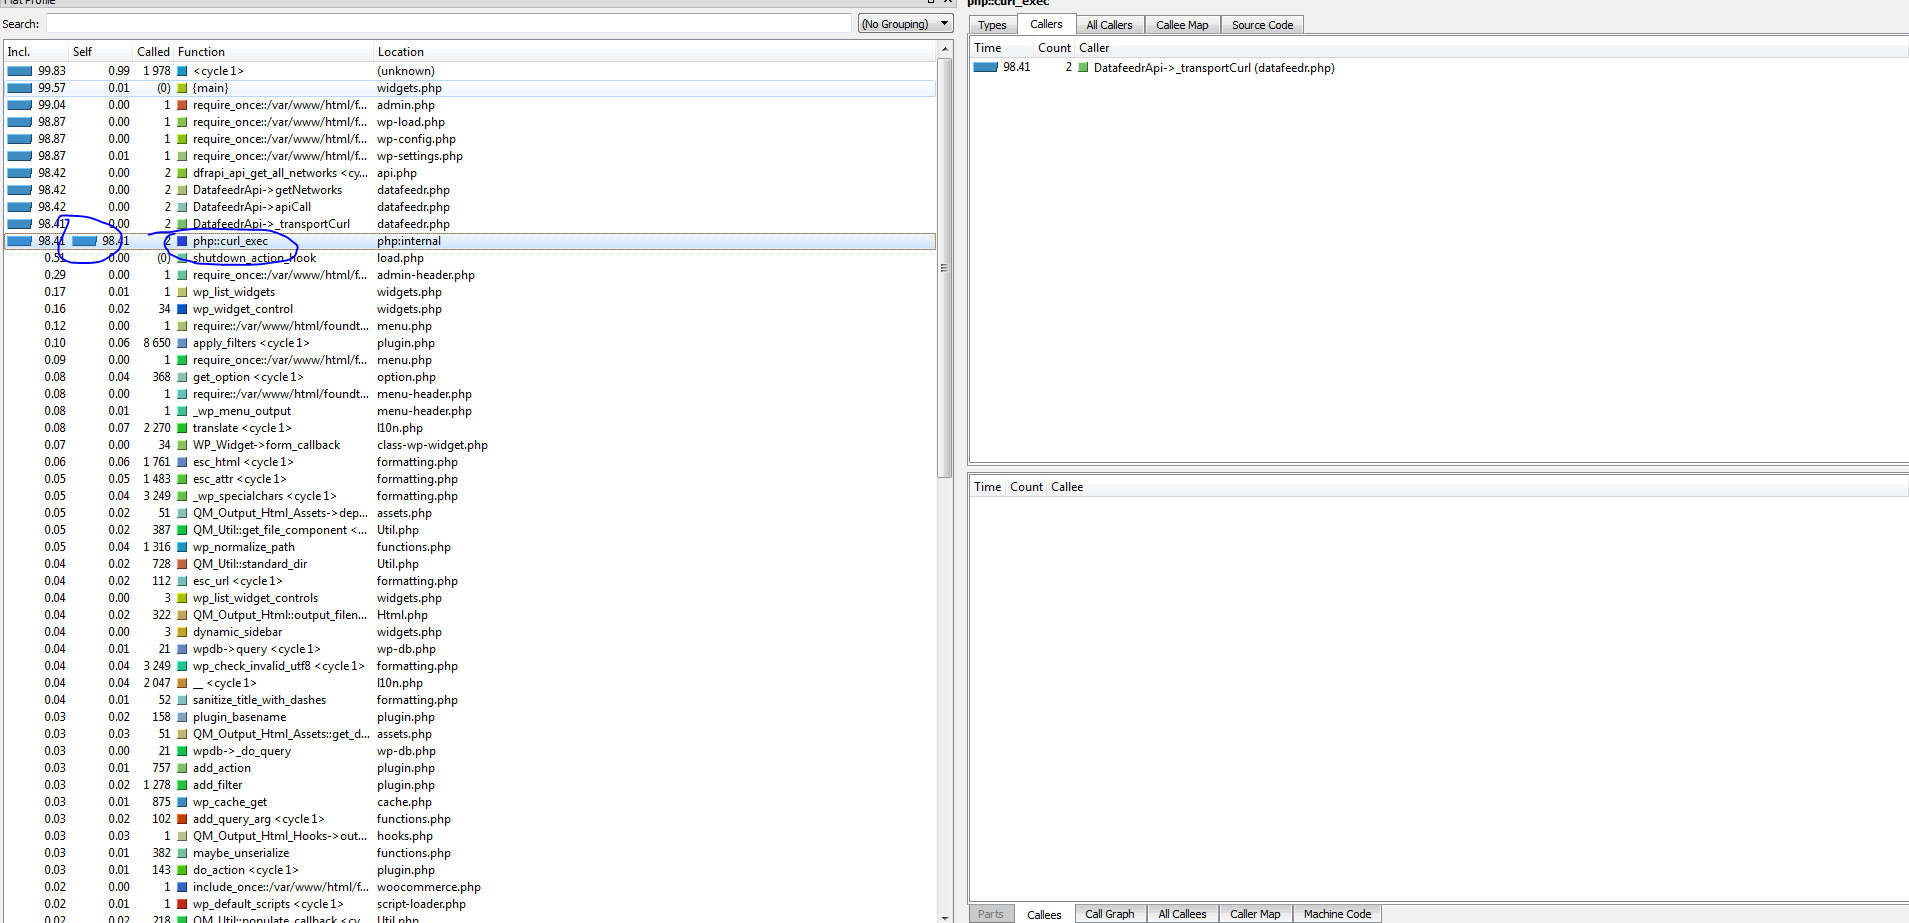
For example, I was getting an elusive 90 second page load on my widgets page on one of my sites. Using XDebug Profiler and QCacheGrind I got this image:

Working from the top downwards, you can see 2 calls to curl_exec – made by the DatafeedrAPI plugin in the datafeedr.php file. These calls are taking 98 seconds. That means I instantly know where to go look to fix this problem.
Turns out, in this case, my server had been updating so many products that the datafeedr website had automatically banned my site!
It’s now unlocked and my WordPress back-end is working at sub-second speeds again.


Just got my Xdebug and QCacheGrind installed and running. But I understand little about how to identify the problematic functions. Like, is “Self” or “Called” a better metric for troubleshooting? What are functions and can they be optimized? What about php::unserialize? And it gets even deeper… Nethertheless, really great post for getting into the topic!
Yes – it can be complicated to get the hang of! Probably Self is a better metric for troubleshooting, but it depends, if that item is called 1000s of times, maybe look at the caller and see why it’s calling so many times.
There’s also a great plugin that I discovered called Code Profiler Pro that can help you narrow in. Then there’s New Relic which you can install and it has a low footprint and once set up can help you identify resource hogs more easily than the cache grind stuff if you’re struggling.
Remember our Discord server too for live chat!
Wheres the onsite chat for contacting you? no form? nothing…
I want a performance analyse…You can contact me for more details, see my mail…
Hi – we temporarily removed the onsite chat. You can email me at support@superspeedyplugins.com.
Please check your e-mail or facebook (regarding FWW existing filter widget attribute urls bug).
Hi Dave,
Thx for your speedy reply 🙂 It worked….
Any suggestions hwo to fix 98.25 php::unserialize? 🙂
Is this 98% time used by unserialize?
That probably reflects using an object cache?
I’m trying to get this installed, but I’m not getting past these two ->
Run: ./configure
Run: make
It says throws an error at the first command:
Check for supported PHP versions… configure: error: not supported. Need a PHP version >= 7.0.0 and < 7.3.0 (found 5.4.16)
I've disabled 5.4.16 in Plesk but that doesn't seems to work
You should ensure you generate the script from your OWN phpinfo.txt file. Instructions included above for how to generate that. Don’t follow my steps, as they’re particular to that specific server.
Once you generate your phpinfo file, copy/paste the contents to the link above where it will then provide specific instructions for your server.
Any options for shared hosting?
The best tool for shared hosting is the Query Monitor plugin. It will help you analyse the cause of poor performance. You can see a guide here to using it: https://www.superspeedyplugins.com/2018/06/30/wordpress-performance-quick-start-guide/
I tried Xdebug profiler with WinCacheGrind but none of the cachegrind files would load properly. They might be too big? They average 8-12mb and I saw a page that suggested 8mb is about the limit. Any suggestions of a workaround or other viewer to use (on Windows)?
I’ve always used QCacheGrind which is based on KCacheGrind.
https://sourceforge.net/projects/qcachegrindwin/
Why do you say that “P3 Profiler is next to useless”??
The P3 profiler is next to useless for a LOT of reasons. The number 1 reason is that it itself consumes a lot of resources. The number 2 reason is it’s innacurate – it didn’t report that Datafeedr was causing my site slowdown for example (because my API license had expired as it turned out, causing 2x 30s HHTP Request timeouts). The number 3 reason is that when it DOES successfully identify the correct plugin that is causing performance problems, it doesn’t identify the source of the problem – e.g. database table scan, to much data retrieved, php loops, function name or anything. It’s crap.
…also, P3 doesn’t support PHP 7 =(
Well there you go then – to be honest, I’m not surprised. It was made by the guys over at GoDaddy and while they’re good at domain names, they’re not so good at plugin development.