Reading the run and completion screens
When you start an import, Super Speedy Imports opens a live screen that shows exactly what the engine is doing, then switches to a completion summary when the run finishes. This article explains what those screens report, why two of the row counts differ, and where to find the record of past runs.
While the import runs
The Run Now screen shows each stage of the import with its own progress bar and worker activity, alongside an overall percentage and an elapsed timer. A system-configuration panel tells you how the run is set up, a live peak-throughput figure shows how fast the engine is going, and a colour-coded engine console streams what is happening underneath. The idea is that you can watch a long import and see at a glance which stage it is in and whether it is healthy.
As each stage finishes, the time shown beside it is the time recorded for that stage in the import’s history, the same figure History shows later. When several short stages run together in one request, each still shows its own time, so the stage times add up to less than the elapsed clock: the difference is the time spent between requests.
A pause on a slow or busy server is normal. A request that takes longer than 30 seconds is asked again, and the server answers for the original, so no row is loaded twice. See Troubleshooting if a run stops after repeated timeouts.
On completion
When the import finishes, the screen changes to a completion summary. This includes a per-stage efficiency table (duration, peak memory and throughput), a velocity panel with average throughput, and a full count breakdown covering posts created and updated, post meta, terms, relationships and taxonomies. You also get auto-fix and integrity totals, an Export Summary download, and a link to view the products the run touched.
When the run removed items with Delete missing items or Delete all, a removed tile shows how many, and whether they were moved to the trash or permanently deleted. History and the email report carry the same counts.
In the paid edition, an import that brings in term images (category or attribute icons, for example) lists them in the import-taxonomies stage as their own Term Images line, with the number of image URLs resolved and the time they took. Term Descriptions and Term Meta Rows then show only the time to write those values.
DB Rows Processed versus CSV Rows
Two row counts sit side by side, and they are usually different numbers on purpose.
CSV Rows is the number of rows read from your file. DB Rows Processed is the sum of rows inserted, updated and deleted on real WordPress tables across every stage, with the temporary CSV staging table excluded.
They differ because a single CSV row rarely maps to a single database row. One product row can write a post, several post-meta rows, term relationships and taxonomy entries, so one CSV row commonly touches many database rows. DB Rows Processed reflects the real work done, which is why it is shown as a rows-per-second badge per stage on the Run Now screen and as a figure with a count breakdown on the completion screen.
Row issues and the error report
Rows with problems are recorded individually rather than being dropped silently. Two common cases are a row skipped because its unique identifier is blank, and a row dropped because another row uses the same identifier. These appear on the completion screen as issue classes with counts.
A Download error report (CSV) button gives you a CSV for the latest run listing the row number, the column and the reason for each problem row, so you can fix your source file and re-import. Prices refused for the wrong decimal format and dates refused because the day and month could be confused are listed here too, each with the reason; Troubleshooting explains each message.
Images that could not be downloaded
Each image is tried up to three times in a run. An image that downloads on a retry is not reported. When some images never downloaded, the completion screen says how many, for example “3 images could not be downloaded”, says the items imported without them, and links to Open this run in History, where each failed URL is listed with its reason. The email report gives the same count. A run whose images all downloaded has no image section.
The History tab
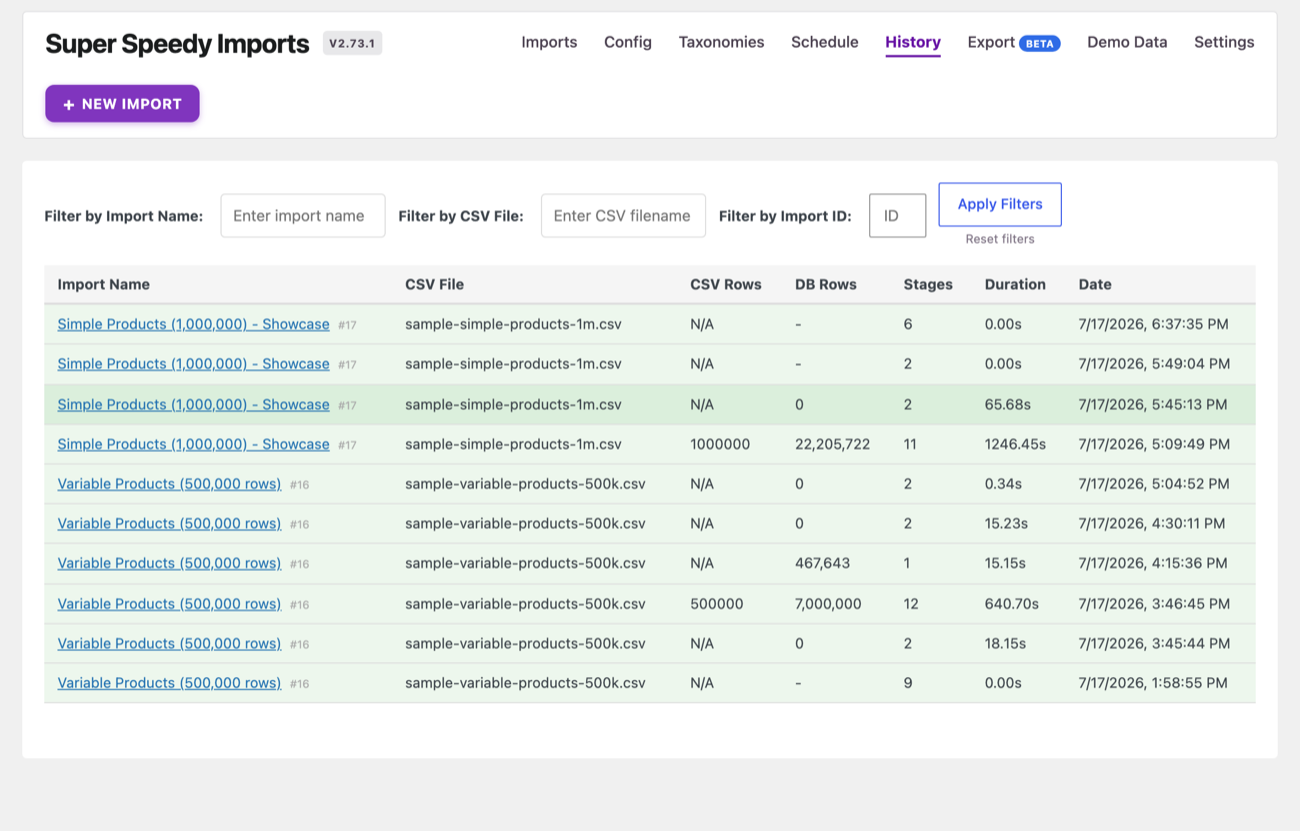
Every run is recorded. The History tab lists past imports with their counters, including a DB Rows column (older runs, from before that metric existed, show a dash). It is the place to look back at what a previous run did and how it performed.
For a first run to practise on, see Trying the demo and sample imports. To understand what each stage in the run is doing, see How imports work: the stage pipeline. If a run leaves items in the Trash, see Trashed items and deletes.
Written for Super Speedy Imports 3.40.0.

Comments