WordPress page generation time: how to measure it and bring it down
Page generation time is how long your server spends building a page before a single byte reaches the browser. It is measured in PHP and database work, not in images, fonts or JavaScript, and it is the part of your site speed that caching hides rather than fixes.
If a tool has told you your page generation time is high, this article explains what that number actually contains, how to find which plugin is responsible, and what to do about each cause.
What page generation time actually measures
The clock starts when PHP begins executing and stops when the finished HTML is handed to the web server. Inside that window sits every plugin that loads, every database query that runs, every option that autoloads and every external HTTP call your site makes while rendering.
It does not include DNS lookup, TLS negotiation, image downloads, render-blocking CSS or JavaScript execution. Those are front-end concerns and they are measured separately.
The distinction matters because the two are fixed in completely different ways. A front-end problem is solved with compression, lazy loading and fewer scripts. A generation-time problem is solved by making the server do less work, and no amount of minification touches it.
A slow page generation time is the one metric a page cache cannot hide. Cached visitors never see it, but every logged-in visitor, every cart and checkout page, every wp-admin screen and every crawler request pays it in full. It is also a scalability limit: each page being generated ties up a PHP worker for its whole duration, so a slow site serves fewer simultaneous visitors.
Where to see your own number
Several tools report it under slightly different names:
| Tool | What it is called |
|---|---|
| Query Monitor | Page generation time |
| GTmetrix / WebPageTest | Time to First Byte (TTFB), minus network latency |
| Chrome DevTools | Waiting (TTFB) on the document request |
| Server access log | $request_time in nginx, %D in Apache |
| Super Speedy Performance Analysis | Median generation time, tracked per run |
TTFB is the closest browser-visible proxy, but it bundles network latency and any edge cache in front of your site, so it flatters a cached page and misleads on a distant one. A server-side measurement is the honest one.
For reading a single request in detail with Query Monitor, including the authentication-cookie trick that lets you measure what a logged-out visitor experiences rather than an admin, see Performance Quick Start Guide: Solving WordPress Performance Problems.
What counts as slow
| Generation time | Verdict |
|---|---|
| Under 500ms | Good |
| 500ms-1s | Worth attention, and it gets worse as the site grows |
| 1-3s | Bad; visitors feel it on every uncached page |
| Over 3s | Dreadful, and something specific is wrong |
These apply to uncached requests. Judge wp-admin, cart, checkout and search by the same scale, because those are the pages real customers spend time on.
Testing your home page from a cache and concluding the site is fast. The home page is the most-cached, least-representative page you own. Measure a product page while logged in, a cart page, and a wp-admin list screen.
What makes generation time high
In practice the causes cluster into a short list, and most sites have two or three of them at once.
Database queries that scan instead of seek. WordPress stores most of what it knows about a post in wp_postmeta, a table that grows at roughly your post count multiplied by your custom field count. Queries against it that have no usable index read the whole table. This is the single most common cause on a WooCommerce store.
Queries running inside loops. A template that fetches one row per product in a list of fifty issues fifty queries where one would do. The individual queries look fast; the sum is not.
SQL_CALC_FOUND_ROWS. WordPress uses this to count total results for pagination. It forces the database to build the entire result set in order to count it, then throws all but one page away.
Autoloaded options. Every option marked autoload = yes is read from wp_options on every single request, including AJAX and cron. Plugins that leave large serialised blobs autoloaded make every page slower, not just their own.
Blocking HTTP calls during render. A licence check, a currency lookup or an analytics ping made synchronously while building the page adds its full round-trip to your generation time, and adds the remote server’s downtime to yours.
Too many plugins doing work on pages that do not need them. A plugin that loads its full stack on every request costs you on every request.
Row counts matter more than query counts. Two hundred queries returning one row each is usually fine; four queries returning eighty thousand rows each will exhaust your PHP memory limit and take seconds. Optimise for rows read, not queries run.
Finding which of these is your problem
Guessing is expensive. Deactivating plugins one at a time on a live site is worse. The efficient path is to measure once, with attribution.
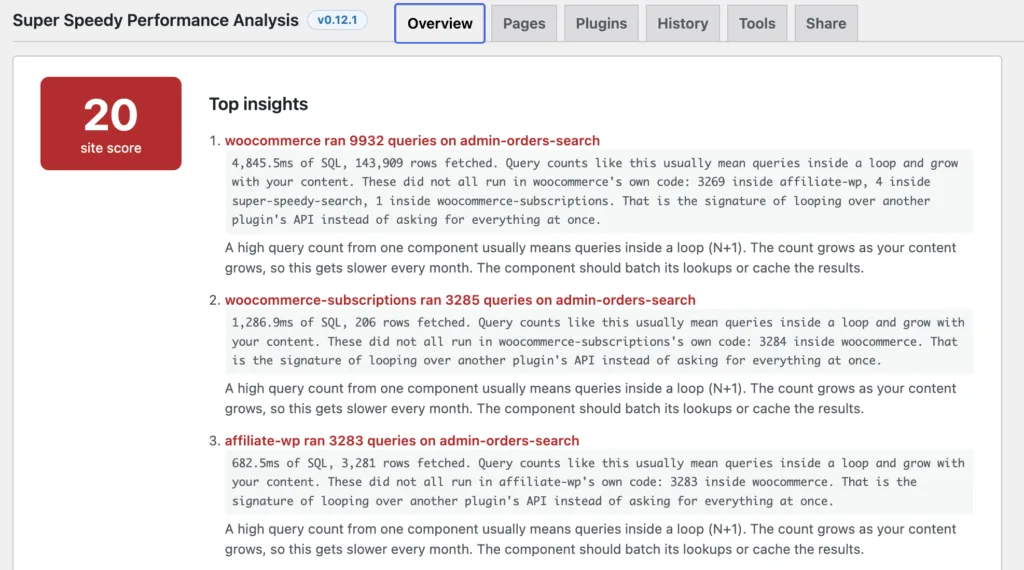
Super Speedy Performance Analysis is free and does this without needing anything installed on the server. It profiles your key pages with its own lean profiler, then attributes the SQL time, query counts, rows fetched and memory to individual plugins and to your theme.
The Overview tab gives a site score and the five findings that matter most, each naming the component responsible.
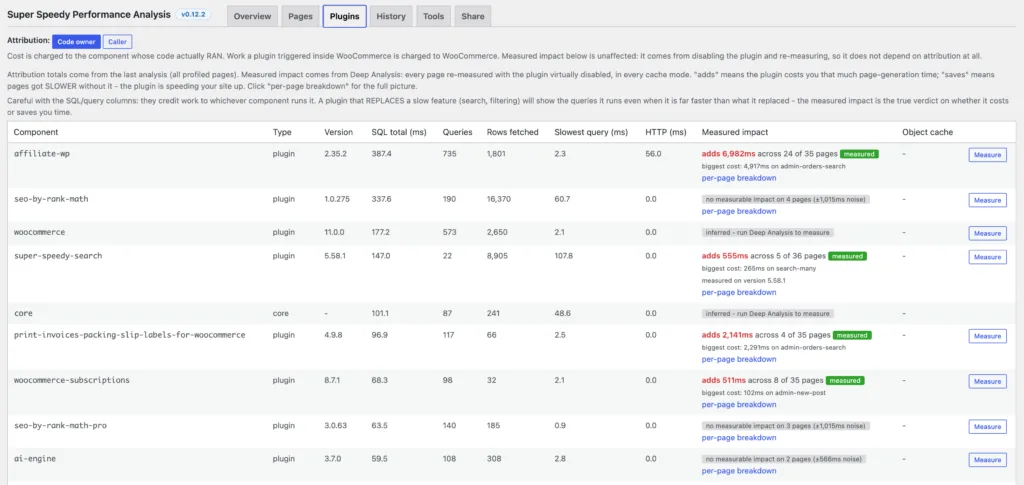
The Plugins tab is usually where the answer is. It ranks every plugin by SQL time, query count and rows fetched across the whole analysis, so “the site is slow” becomes “this plugin spends 400ms in the database on every product page”.
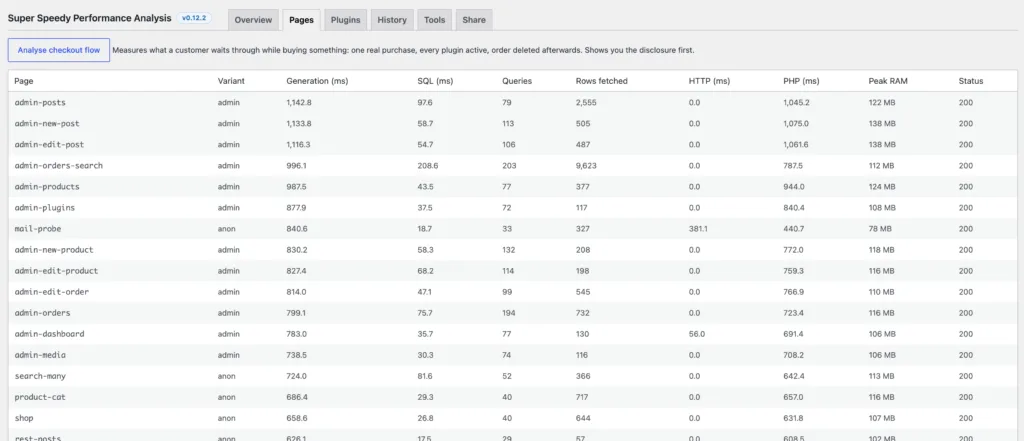
The Pages tab drills into a single page: its slowest queries, which plugin ran each one, and any HTTP calls made during render. Captured queries are put through MySQL’s EXPLAIN afterwards, so a slow query is reported with the reason it is slow – no usable index, a temporary table, a filesort – rather than only the fact that it took a while.
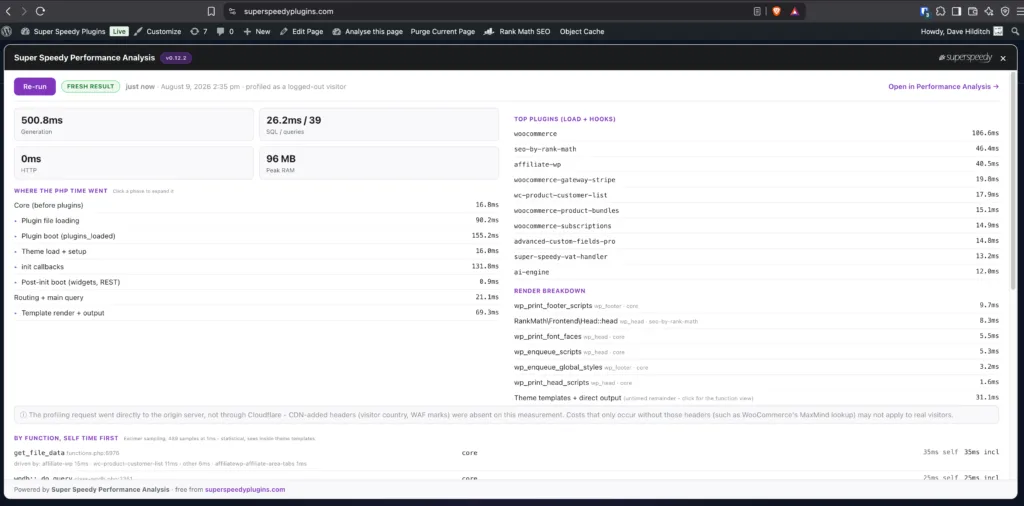
The ‘Analyse this page’ option lets you see a detailed breakdown on each specific page giving you total insight into why any page on your website is running slowly.
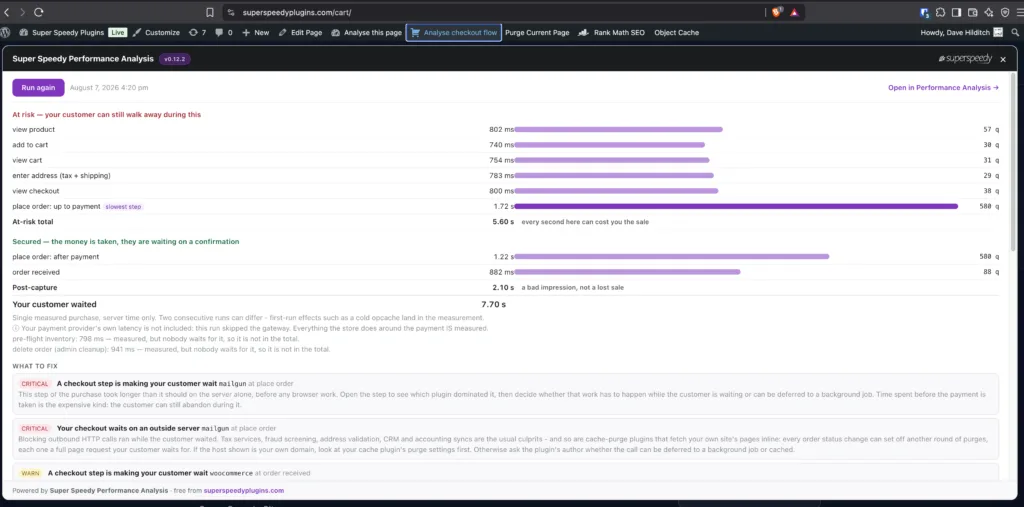
The checkout flow analysis creates orders and puts them through your checkout so you can find out what’s happening behind the scenes at the most critical stage of your site – accepting money!
EXPLAIN runs during analysis, never inside a profiled request, so it cannot distort the measurement it is explaining. It never executes the query either – only the plan is read.
When several plugins look guilty, deep analysis settles it by virtually disabling plugins for test requests only, measuring each suspect’s true cost. Live visitors are never affected.
The History tab records median generation time across runs, which answers the question that matters as a site grows: is this getting worse?
Run an analysis before you change anything, and keep it. Without a baseline you cannot tell whether a fix worked or whether traffic simply changed, and “it feels faster” is not a measurement.
Fixing what you find
Missing indexes on postmeta and friends
The fix is an index that lets the query seek instead of scan. Adding one by hand means knowing which columns, in which order, with which prefix lengths – and getting it wrong costs disk and write speed for no gain.
Scalability Pro carries a curated set of these for the tables WordPress and WooCommerce query hardest: wp_postmeta, wp_posts, wp_term_relationships, wp_term_taxonomy, wp_terms and WooCommerce’s product lookup table. Each is named, so it can be removed again precisely.
On a 2.03 million row wp_postmeta table, the SELECT DISTINCT meta_key probe that WordPress’s custom-fields metabox runs went from a 950ms full table scan to a 1.4ms index scan.
SQL_CALC_FOUND_ROWS
Scalability Pro can replace the count with a cheaper equivalent, so pagination still works without building the full result set to count it.
Autoloaded options
Find the large ones and stop them autoloading. The Managing the wp_options Table and Autoload article covers how to identify them safely and which are safe to change.
Queries in loops, and plugins doing work they need not
These are plugin-specific and the analysis names the culprit. Sometimes the answer is a setting, sometimes a lighter alternative, sometimes a support ticket to the plugin author with the evidence attached – which the analysis gives you in a form they cannot dismiss.
The whole class of problem
The reason the two plugins work well together is that they solve different halves. The analysis identifies causes with evidence; Scalability Pro carries fixes for the common ones so they do not have to be built by hand.
- WooCommerce stores where uncached pages, cart and checkout feel slow
- Sites where wp-admin has become painful to use
- Any site whose database has grown past a few hundred thousand postmeta rows
- Anyone who has been told “your TTFB is high” and does not know why
- Your problem is images, fonts or JavaScript – that is front-end work, and a different article
- Your site is small and fast and you are optimising out of habit
- You have not measured yet – start with the analysis, not with a fix
Common mistakes
Adding a page cache and calling it fixed. Caching hides generation time from anonymous visitors. Logged-in users, carts, checkouts and wp-admin still pay it, and those are the pages that make you money.
Adding indexes speculatively. Every index costs disk and slows writes. Add the ones your own slow queries need, which means measuring first.
Optimising the home page. It is usually the fastest page you own and the least representative.
Chasing query count. A page running 300 fast queries is often healthier than one running 6 that each read 50,000 rows.
Comparing TTFB across tools. Different tools measure from different places with different network paths. Compare a number only against itself over time.
Frequently asked questions
Is page generation time the same as TTFB? No. TTFB includes network latency and any edge cache in front of your site. Page generation time is purely server-side work. TTFB is a reasonable proxy when measured from a consistent location, but it is not the same number.
Does a page cache fix a slow generation time? It hides it for anonymous visitors on cacheable pages. Cart, checkout, wp-admin, and every logged-in session still pay it in full.
Why is wp-admin slower than the front end? Admin screens run list tables, counts and meta queries that the front end does not, they are never page-cached, and every plugin loads its admin code. The same diagnosis applies.
My host says the server is fine. Who is right? Both, usually. Generation time is dominated by what your PHP and database are asked to do, not by how fast the hardware is. A faster server makes bad queries less bad; it does not make them good.
How much can I expect to gain? It depends entirely on the cause, which is why measuring first matters. A missing index on a large wp_postmeta can be the difference between a second and a few milliseconds. A front-end problem misdiagnosed as a back-end one gains nothing.



Comments